s
c
r
o
e
r
Join our community
PowerBI
@alexinosss
Source
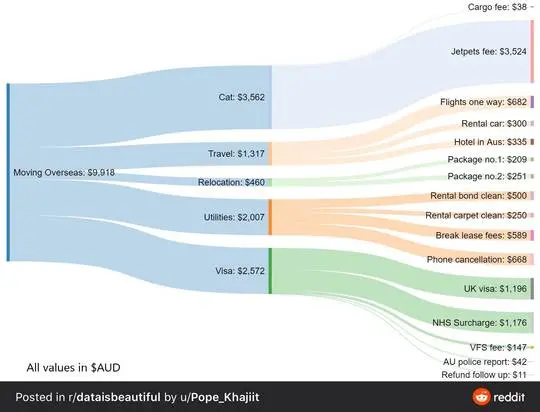
Hi guys! I’ve seen quite a few of these graphs recently. Do you have any idea how to do this type of graphs in power bi?
0
0
Auto
More like this
Home
Discover
Upload
Collection
Login